To succeed in today’s world, terminals have to do more with less while staying at the forefront of innovation and optimization. Increasing vessel sizes and heightened customer expectations push the traditional limits of terminal processes and throughput. Terminals constantly look for ways to improve efficiency just to keep up.
Luckily, data analytics is the perfect tool to help terminals solve these challenges. The problem, however, is that too few organizations use data to its full potential. When done right, data drives a never-ending cycle of improvement and success. When done wrong, data can create a mess that no one wants to clean up.
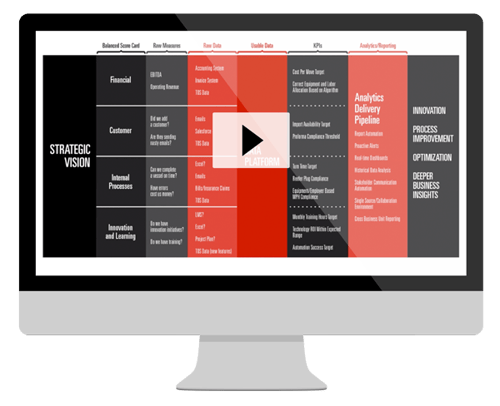
Here is how it works. Good data can drive innovation that improves operations and shapes the strategic vision of an organization. That strategic vision then guides analytical questions that feed into data collection, which drives more innovation. The end result? A continuous feedback loop of constant improvement within a business — something that we at Tideworks call the Virtuous Cycle of Innovation.

Optimizing the Business Intelligence
(BI) of Your Terminal
Anyone that’s dealt with large volumes of information before has seen it. The neverending Excel spreadsheet filled with data. Column after column and row after row, numbers, and labels divided into identical little boxes, stretching off into infinity.
The old days of business intelligence (BI) weren’t that long ago. The field is moving forward at breakneck speed, and data practices that were unheard of just a few years ago are now commonplace. The way businesses, and terminals specifically, should approach their data collection is changing, and those that ignore the shift will find themselves at a disadvantage.
The industry is moving away from the old days of business intelligence, but many terminal operations are still living there. For some, it’s still regular practice to manually collect data into an Excel spreadsheet and then clean and verify it by hand. Every report requires hours of work, and the opportunity for error is ever-present. It is a labor-intensive, time-consuming process that undermines time-sensitive insights.
Enter Business Intelligence
There’s a better way. BI automation replaces manual data collection with an automated process that can pull information from every segment of a terminal’s operation in real-time, providing a rich data pool that can yield critical insights on a continual basis. Automation unlocks the true power of business intelligence, creating a positive feedback loop of constant, incremental improvements.
BI has risen to prominence in recent years as a comprehensive solution to the problem of opaque business systems. BI technologies allow enterprises to collect vast amounts of data from across the entirety of their operations in order to understand how every action and every decision can influence efficiency and profitability. This involves data mining, data preparation, and data analytics, driven by powerful, connected software.
Most terminal operators are already tracking data. They’ve likely compiled a few key performance indicators (KPIs) that they keep an eye on as an indication of the health of their terminal. KPIs are certainly important, but their usefulness is limited when you don’t understand the more granular processes that drive those metrics.
As an example, most terminal operators measure turn times. This single metric, if it’s trending down, can indicate problems in the terminal. But it can’t tell you what the problems are. Poor turn-times could be driven by a host of issues. Without an optimized data platform and business intelligence solution, finding the problem can be a wasteful guessing game.
A better strategy is to collect all the data points related to turn times and then correlate them with real-time changes. Terminal operators might gather information about behaviors at critical points, gate throughput levels, gate clerk efficiency, and relative yard congestion levels, and look for patterns, where certain events coincide with lower turn times.

The Difference Between Collecting and Using Data
As the gargantuan excel spreadsheets that we all still have nightmares about will show, collecting data isn’t the hard part. In today’s digital world, data can be culled from a superfluous number of sources. But the result is a massive, impenetrable data set that hides its insights in tiny, white boxes.
What’s needed is a tool that can sort through all of this data, and not just from one source, but from every source, allowing users to easily make meaningful connections between all of those boxes. This can make the difference between a report that just gets read and one that provokes useful action and helps an organization reach its goals.
Is an ERP Enough?
Many organizations turn to Enterprise Resource Planning software (ERP) to centralize their extended business functions, like inventory and order management, accounting, human resources, customer relationship management, and more. These tools allow data to flow seamlessly between each function, eliminating duplication and creating the start of a connected data collection.
However, for terminals and other businesses, this is only half of the picture. An ERP misses the operational side of the equation. This is critical data that, if it’s collected at all, lives in an entirely different realm, disconnected from the financial side of the business.
In essence, you have two separate spheres, both collecting data, with no way to bridge the two. Without a way to fuse those two halves together, you can’t meaningfully use the data you’re collecting.
360 Degree Data Visibility
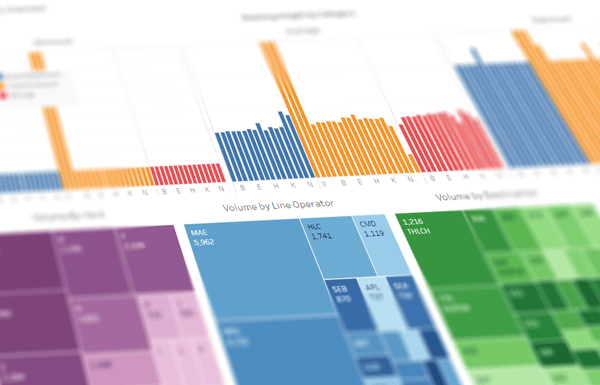
What modern terminals need today are data platforms that can pull from a variety of sources. For example, you could use Tideworks Insight to align project numbers from every source into the same column, aggregating all the various pieces of data tied to those project numbers for a complete picture of each project. You could look at project, vessel, or job data from every possible angle simultaneously, whether you need cost information, performance information, or KPI measurements. All of these are instantly available from one central platform and all linked for easy analysis. This gives users the clearest picture of their terminal operations possible.
Your next data management solution should provide a seamless connection to the data in your Terminal Operating System (TOS) as well as ancillary systems like:
- Gate automation technologies (OCR, RFID, etc.)
- Appointment systems
- HR systems
- Equipment telematics and positioning systems
- Accounting / ERP systems
The Importance of Historical and Real-Time Data
To be useful in your decision-making, data analysis requires two things — historical information and real-time events. The real-time data tells you what is happening right now: are you meeting KPIs? How many moves were made today? Are you ahead or behind schedule?
Real-time data has a purpose, but it is most powerful when you have something to measure the data against. Are you meeting more KPIs this month than last? What months are the busiest and why? Based on last year’s performance, are this year’s KPIs reasonable? That’s where historical data comes in. By having access to terminal data that goes back months, or even years, you can establish the context required to give your real-time data significance. Historical data gives you the context, trends, and bigger picture.
If data is a book, then real-time stats are the current chapter and historical information is the whole story up to that chapter. You need both to understand what happens next.
Data is the difference between a gut feeling and an informed, confident decision. Good data can answer a question. Great data can quash uncertainties, provide objective evidence in the midst of human bias, and allow for the type of analysis that leads to improved performance through carefully curated hypotheses.
The most powerful modern data management systems, however, offer the ability to manage historical data and real-time simultaneously. While most systems today provide both types of datasets, Tideworks Insight is the only platform that combines them in a single, integrated database. This cuts back on both redundancy and processing time and lets the system compile a third dataset — change information. Not only can Tideworks Insight tell you what happened in the past and what is happening now, but it can also tell you what the differences are between the two. All of these features work towards making your data easier to access and analyze.
Modern Data Management In Action
Let us assume that you are a terminal operations manager at a busy port. You may often face congestion issues that cause extended gate turn times. The results include frustrated truckers whose potential earnings may be affected by lengthy delays and cargo owners who demand to know the whereabouts of their shipments.
As an illustration of a normal turn time at a terminal, the average turn time at the Port of Los Angeles is estimated to be 60-70 minutes, although time spent settling a trouble ticket, waiting in line to receive a full container or requiring roadability repairs could add to the time. Other issues that could translate to longer wait times for truckers include:
- An unexpected surge in cargo volume (terminal congestion)
- Reliability of vessel schedules (resulting in delays in cargo being offloaded)
- Equipment shortages or equipment breakdowns
- The number of yard re-handles needed to dig a container out from a stack
- Hours of terminal operations (particularly with regard to breaks)
Without an advanced data management solution, you’re forced to rely on the experience and educated guesses of talented operators to diagnose root issues and make recommendations. However, even the best, most experienced terminal operators, unequipped with the best tools, are going to make mistakes that are costly.
So how would a data platform change all this? How would it assist you in moving from problem identification to powerful remedies efficiently? Going back to our example of measuring and analyzing turn times, let’s walk through a simple decision-making timeline and how our data platform, Tideworks Insight, can help you move from problem detection to resolution quickly.
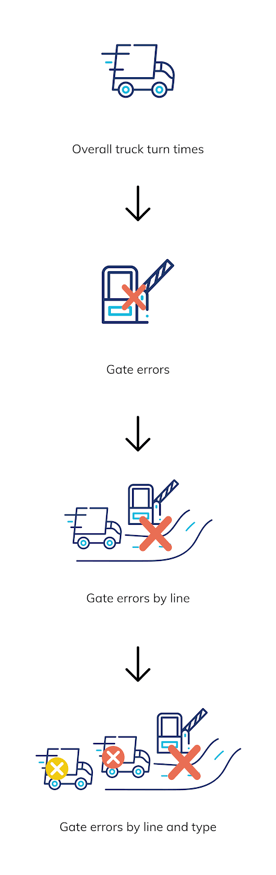
- The terminal operator discovers gradual increases in turn times. They set out to investigate whether turn-times are increasing in general or in specific areas of the operation.
- Drilling-down into the data, they find that a particular shipping line is experiencing longer turn times than the terminal average.
- Through data analysis, they also find it is a consistent issue of increasing turn times, not an isolated incident affecting the average.
- The data also shows frequent trouble ticket submissions relating to booking errors at the gate.
- This issue caused extra dispatcher calls and forced the trucker to re-enter the queue, affecting both truck turn times and gate throughput in the process.
- By identifying the root cause of the issue, the terminal could reach out to the shipping line to notify them of the frequent booking mismatches.
- The shipping line was then able to identify and rectify a problem with EDI booking transmissions to the terminal, resulting in an immediate decrease in turn times.
This example represents the type of issue that can be quickly identified and resolved with the Tideworks Insight data platform. The platform allows users to look at segments of a turn time, not just the turn time as a whole. Data like this can be uncovered in a few simple clicks.
Shifting to a Data-Driven Mindset
Regardless of your situation, having a data-centric mindset in your organization from top to bottom can and will improve your operations, if you do it correctly. Additionally, data does not have to (and should not) be a cumbersome task of number crunching that requires entire teams of analysts months to calculate. Being data-driven can be both easy and effective.
The Tideworks team has collected our four best tips to begin the process of systematically shifting to a data-driven mindset throughout your operation.

1. Understand That You Need Data
Recognizing the importance of data is the first true step to gaining a data-driven mindset. The list of ways that data analytics can improve terminal operations is lengthy. Some key points include:
- It can provide insights on every aspect of your operations, giving decision-makers at every level the information they need to make wise decisions.
- Data can identify best practices as well as processes that could be improved.
- It can reveal and predict choke points in efficiency, surface trends, and even forecast coming problems, allowing your organization to prepare for the future.
- Data is the first step to automation — and automation is a critical ingredient to efficiency, scalability, and growth.
2. Choose the Right Tools
The best platform is one that speaks the same language you do: the language of terminal operations. A data platform tailored for your industry and operations will be more useful than a generic analytical tool. You wouldn’t ask a shipbuilder to build a house just because he’s good with his hands. In that same way, don’t settle for a data analytics tool that isn’t specialized for your line of work.
3. Find the Right Advocate
While being a data-driven organization requires the buy-in of everyone, having a person or team of people who can lead the analysis and manage the data platform is key. It doesn’t take a data scientist — anyone with a sense of curiosity to ask questions and the drive to discover the answers will fit the bill.
4. Get Buy-In From the Very Top
Like with any organizational vision, the desire for a data-mindset has to start at the top of the command chain in order to be implemented successfully. Lower-level leaders cannot be expected to rely on data to drive innovation and influence their decision-making if they feel it’s not a priority for the company. No one wants to dedicate time and resources to an initiative that their leaders might not value.
Building a Data Team that Drives Productivity and Results
Be it Operations, IT, or Executives, all of these team members have plenty of work on their plates and each specializes in their own specific areas. For powerful data management platforms to work optimally, all of these professionals need to work together cohesively.
That being said, who is it that should spearhead the implementation of Tideworks Insight in a business?
Is it the Operations staff? They know the business process on the ground but might struggle with the data analytics functions of the tool.
How about IT? They are the experts with the data and architecture, however, they are unfamiliar with how the Operations teams utilize the tool and how they work on a day to day basis.
The Executives? As if they need another thing on their plate…
For many companies, this question brings up the need for a dedicated data analyst; one who is familiar with the operation’s process, can analyze data, and is comfortable working with all of the teams involved. By adding this crucial piece to the team, IT, Operations, and others are free to focus on their day-to-day work. The data analyst can keep all teams in the loop through the implementation process. Plus, by having this process be on-terminal, it becomes easier for the Operations teams (who ultimately are the final users of the tool) to buy in due to the ease of access to the analyst.